Practicum 3: Hipster Migration
In the news, you occasionally hear about a demographic trend of people preferring to move into the city center as opposed to the suburbs. Such a trend is often attributed to the hipster "millenials" who stereotypically prefer to live in urban centers and forego cars in favor of fixed gear bikes, trains, and smart phones.
In this practicum, we’re explore that hypothesis. Here’s the idea, if you look at a map of the CTA, you see various rail lines originating downtown and pointing outwards towards the suburbs.
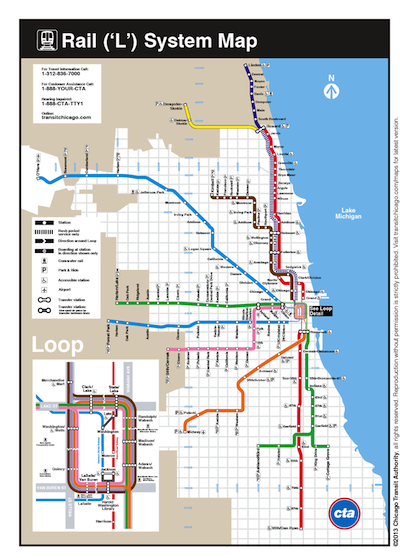
If people are really moving into the city instead of the suburbs, perhaps you might see a long-term drop in ridership at the outer-most stations and an increase in ridership at stations in the city center. In Practicum 2, you already figured out the ridership change for various L stations. Does that data support this idea?
(a) Reading train ridership data
First, you just wrote a function parse_csv() that can read CSV files and
perform type conversion. You should change your ctarail.py program to use
your function. For example:
import fileparse
rides = fileparse.parse_csv('Data/ctarail.csv', types=[int, str, str, str, int])
Make this change and make sure your code still works. Just to recall, your code should be producing a table such as this:
Id   |Name                     |Count   |Change
-----|-------------------------|--------|--------
41400|Roosevelt                |33249846| 1817656
41660|Lake/State               |51524924| 1680578
40380|Clark/Lake               |56772423| 1378717
41220|Fullerton                |43086899| 1284827
...
41170|Garfield-Dan Ryan        |15741450| -169546
40990|69th                     |23355328| -310984
40450|95th/Dan Ryan            |50304330| -355227
40500|Washington/State         |14321124|-2179181
(b) Joining with geographic coordinates
At this point, you have the change in raw rider counts for each station. However, you don’t have much information about the stations themselves. Let’s fix that by bringing in some details such as the latitude and longitude coordinates of each station.
The file Data/ctastops.csv contains information about all bus/rail
stops in the CTA system including GPS coordinates. Here is what the
data looks like:
stop_id,stop_code,stop_name,stop_desc,stop_lat,stop_lon,location_type,parent_station,wheelchair_boarding
1,1,"Jackson & Austin Terminal","Jackson & Austin Terminal, Northeastbound, Bus Terminal",41.87632184,-87.77410482,0,,1
2,2,"5900 W Jackson","5900 W Jackson, Eastbound, Southside of the Street",41.87706679,-87.77131794,0,,1
...
Use your parse_csv() function to read a subset of this data including the latitude and longitude coordinates:
>>> stopdata = fileparse.parse_csv('Data/ctastops.csv',
                                    select=['stop_id', 'stop_lat', 'stop_lon'],
                                    types=[int, float, float])

>>> len(stopdata)
12169
>>> stopdata[0:4]
[{'stop_lat': 41.87632184, 'stop_lon': -87.77410482, 'stop_id': 1}, {'stop_lat': 41.87706679, 'stop_lon': -87.77131794, 'stop_id': 2}, {'stop_lat': 41.87695725, 'stop_lon': -87.76975039, 'stop_id': 3}, {'stop_lat': 41.87702418, 'stop_lon': -87.76745055, 'stop_id': 4}]
>>>
Now, modify your program so that the summary table also includes geographic coordinates. For example:
Id   |Name                     |Count   |Change  |Latitude  |Longitude
-----|-------------------------|--------|--------|----------|----------
41400|Roosevelt                |33249846| 1817656| 41.867379|-87.627031
41660|Lake/State               |51524924| 1680578| 41.884809|-87.627813
40380|Clark/Lake               |56772423| 1378717| 41.885737|-87.630886
...
40990|69th                     |23355328| -310984| 41.768367|-87.625724
40450|95th/Dan Ryan            |50304330| -355227| 41.722377|-87.624342
40500|Washington/State |14321124|-2179181| 0.000000| 0.000000(c) Writing CSV files
Modify your program so that the information shown in the table can be obtained as a list of tuples. For example:
data = [
        (41400, 'Roosevelt', 33249846, 1817656, 41.8673785311, -87.6270314058),
        (41660, 'Lake/State', 51524924, 1680578, 41.884809, -87.627813),
        (40380, 'Clark/Lake', 56772423, 1378717, 41.885737, -87.630886)
        ...
]
The csv module also provides support for writing CSV files. For example:
>>> import csv
>>> f = open('data.csv', 'w')
>>> f_csv = csv.writer(f)
>>> f_csv.writerow(['station_id','station_name','count', 'change', 'latitude','longitude'])
>>> f_csv.writerows(data)
>>> f.close()
>>>
Using your collected data, have your program write two separate CSV files. Create a file loss.csv that contains data for stations that lost ridership.
station_id,station_name,count,change,latitude,longitude
40840,South Boulevard,2846885,-1371,42.027612,-87.678329
41140,King Drive,2442306,-10958,41.78013,-87.615546
41190,Jarvis,5569764,-11898,42.0160204165,-87.6692571266
40720,East 63rd-Cottage Grove,4871810,-14643,41.780309,-87.605857
...
Next, create a file gain.csv that contains data for the 40 stations that gained the most ridership. It should look something like this:
station_id,station_name,count,change,latitude,longitude
41400,Roosevelt,33249846,1817656,41.8673785311,-87.6270314058
41660,Lake/State,51524924,1680578,41.884809,-87.627813
40380,Clark/Lake,56772423,1378717,41.885737,-87.630886
...
At this point, you should have two separate CSV files. One that lists the stations that lost ridership and one that lists stations with the most growth in ridership.
(d) Make a map!
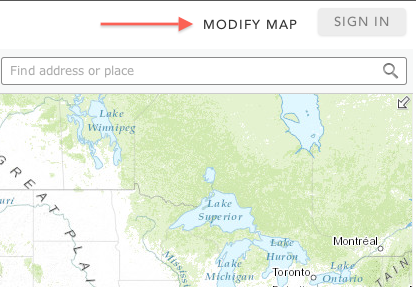
What’s good data without making a cool map? There are many services on the web that allow you make custom maps. For example, go visit the ArcGIS website at http://www.arcgis.com/home/webmap/viewer.html. Click on the button Modify Map in the upper right corner (as indicated by the red arrow):
Once you’ve done that, you can add data to the map by selecting the following:
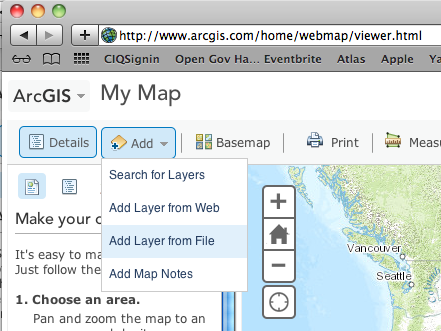
Add the loss.csv and gain.csv files to the map and see if you see if you can
make an interesting map. For example, maybe something like this:
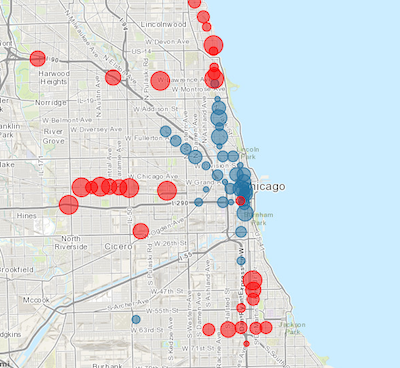
Yes, you’re definitely ready to be a civic planner now!