Exercise 4.6
(a) Install pip
Install pip (https://pypi.python.org/pypi/pip) on your system if it isn’t already there. If it’s installed, you should be able to type a command such as this:
bash % python -m pip --help
Usage: pip COMMAND [OPTIONS]

Options:
  --version             show programs version number and exit
...
bash %
(b) Install numpy
The numpy extension adds support for arrays and matrices to
Python. Use pip to install numpy on your machine:
bash % python -m pip install numpy
Once you have it, try the following example:
>>> import numpy
>>> a = numpy.array([1,2,3,4])
>>> b = numpy.array([5,6,7,8])
>>> a+b
array([ 6,  8, 10, 12])
>>>
(c) Install pandas
The pandas library is useful for performing kinds of data analysis. Install it
and use it to read a CSV file:
>>> portfolio = pandas.read_csv('Data/portfolio.csv')
>>> portfolio
   name  shares  price
0    AA     100  32.20
1   IBM      50  91.10
2   CAT     150  83.44
3  MSFT     200  51.23
4    GE      95  40.37
5  MSFT      50  65.10
6   IBM     100  70.44

>>>
(d) Install matplotlib
The matplotlib extension adds support for plotting. You
task: install matplotlib and try making a plot:
>>> from matplotlib import pyplot
>>> import numpy
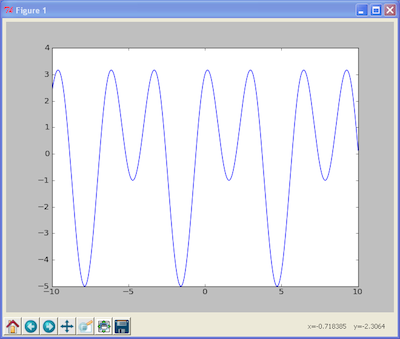
>>> x = numpy.linspace(-10,10,1000)
>>> y = 2*numpy.sin(x)+3*numpy.cos(2*x)
>>> pyplot.plot(x,y)
[<matplotlib.lines.Line2D object at 0x12aea370>]
>>> pyplot.show()
>>>
If it works, you should get a plot that looks like this: